About CodeQL pull request alerts metrics
The metrics overview for CodeQL pull request alerts helps you to understand how well CodeQL is preventing vulnerabilities in your organizations. You can use the metrics to assess how CodeQL is performing in pull requests, and to easily identify the repositories where you may need to take action in order to identify and reduce security risks.
The overview shows you a summary of how many vulnerabilities prevented by CodeQL have been caught in pull requests. The metrics are only tracked for pull requests that have been merged into the default branches of repositories in your organizations.
You can also find more granular metrics, such as how many alerts were fixed with and without Copilot Autofix suggestions, how many were unresolved and merged, and how many were dismissed as false positive or as risk accepted.
You can also view:
-
The rules that are causing the most alerts, and how many alerts each rule is associated with.
-
The number of alerts that were merged into the default branch without resolution, and the number of alerts dismissed as an acceptable risk.
-
The number of alerts that were fixed with an accepted Copilot Autofix suggestion, displayed as a fraction of how many total Copilot Autofix suggestions were available.
-
Remediation rates, in a graph showing the percentage of alerts that were remediated with an available Copilot Autofix suggestion, and the percentage of alerts that were remediated without a Copilot Autofix suggestion.
You can apply filters to the data. The metrics are based on activity from the default period or your selected period.
Note
Metrics for Copilot Autofix will be shown only for repositories where Copilot Autofix is enabled.
Viewing CodeQL pull request alerts metrics for an organization
-
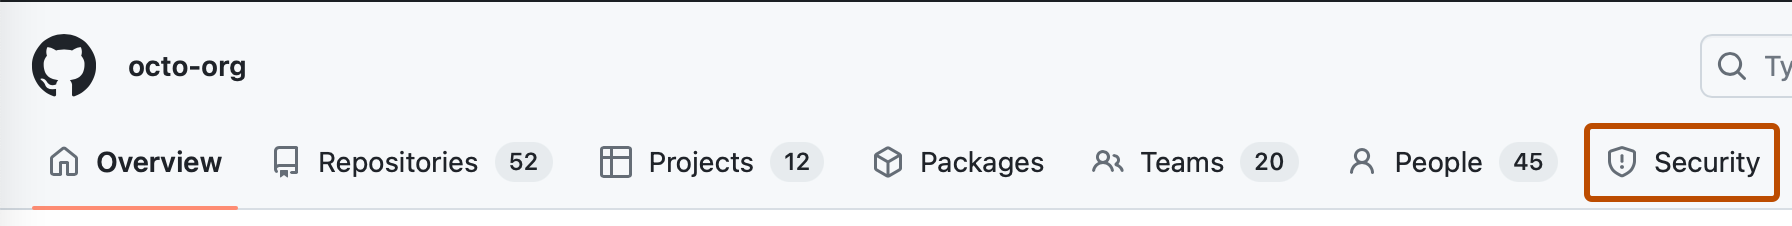
On GitHub, navigate to the main page of the organization.
-
Under your organization name, click Security.
-
In the sidebar, under "Metrics", click CodeQL pull request alerts.
-
Optionally, use the date picker to set the time range. The date picker will show data based on the pull request alerts' creation dates.
-
Optionally, apply filters in the search box at the top of the page.
-
Alternatively, you can open the advanced filter dialog:
- At the top of the page, next to the search box, click Filter.
- Click Add a filter, then select a filter from the dropdown menu.
- To search for repositories matching the selected filter, fill out the available fields for that filter, then click Apply. You can repeat this process to add as many filters as you would like to your search.
- Optionally, to remove a filter from your search, click Filter. In the row of the filter you want to remove, click , then click Apply.
-
You can use the Export CSV button to download a CSV file of the data currently displayed on the page for security research and in-depth data analysis. For more information, see Exporting data from security overview.

Viewing CodeQL pull request alerts metrics for your enterprise
You can also view metrics for CodeQL alerts in pull requests across organizations in your enterprise.
Tip
You can use the owner filter in the search field to filter the data by organization. If you're an owner of an enterprise with managed users, you can use the owner-type filter to filter the data by the type of repository owner, so that you can view data from either organization-owned repositories or user-owned repositories. For more information, see Filtering alerts in security overview.
-
Navigate to GitHub Enterprise Cloud.
-
In the top-right corner of GitHub, click your profile photo, then click Your enterprises.
-
In the list of enterprises, click the enterprise you want to view.
-
On the left side of the page, in the enterprise account sidebar, click Code Security.
-
In the sidebar, under "Metrics", click CodeQL pull request alerts.