Enterprise Server 3.15 в настоящее время доступен в качестве кандидата на выпуск.

Панель мониторинга активности

Панель мониторинга активности содержит общие сведения обо всей деятельности на предприятии.

The Activity dashboard provides weekly, monthly, and yearly graphs of the number of:

  • New pull requests
  • Merged pull requests
  • New issues
  • Closed issues
  • New issue comments
  • New repositories
  • New user accounts
  • New organizations
  • New teams

Accessing the Activity dashboard

  1. In the top-left corner of any page, select , then click Explore.

    Screenshot of the navigation bar on GitHub Enterprise Server. The "Open global navigation menu" icon is outlined in dark orange.

  2. In the upper-right corner of the page, click Activity.

  3. To view activity over different periods, click This week, This month, or This year.
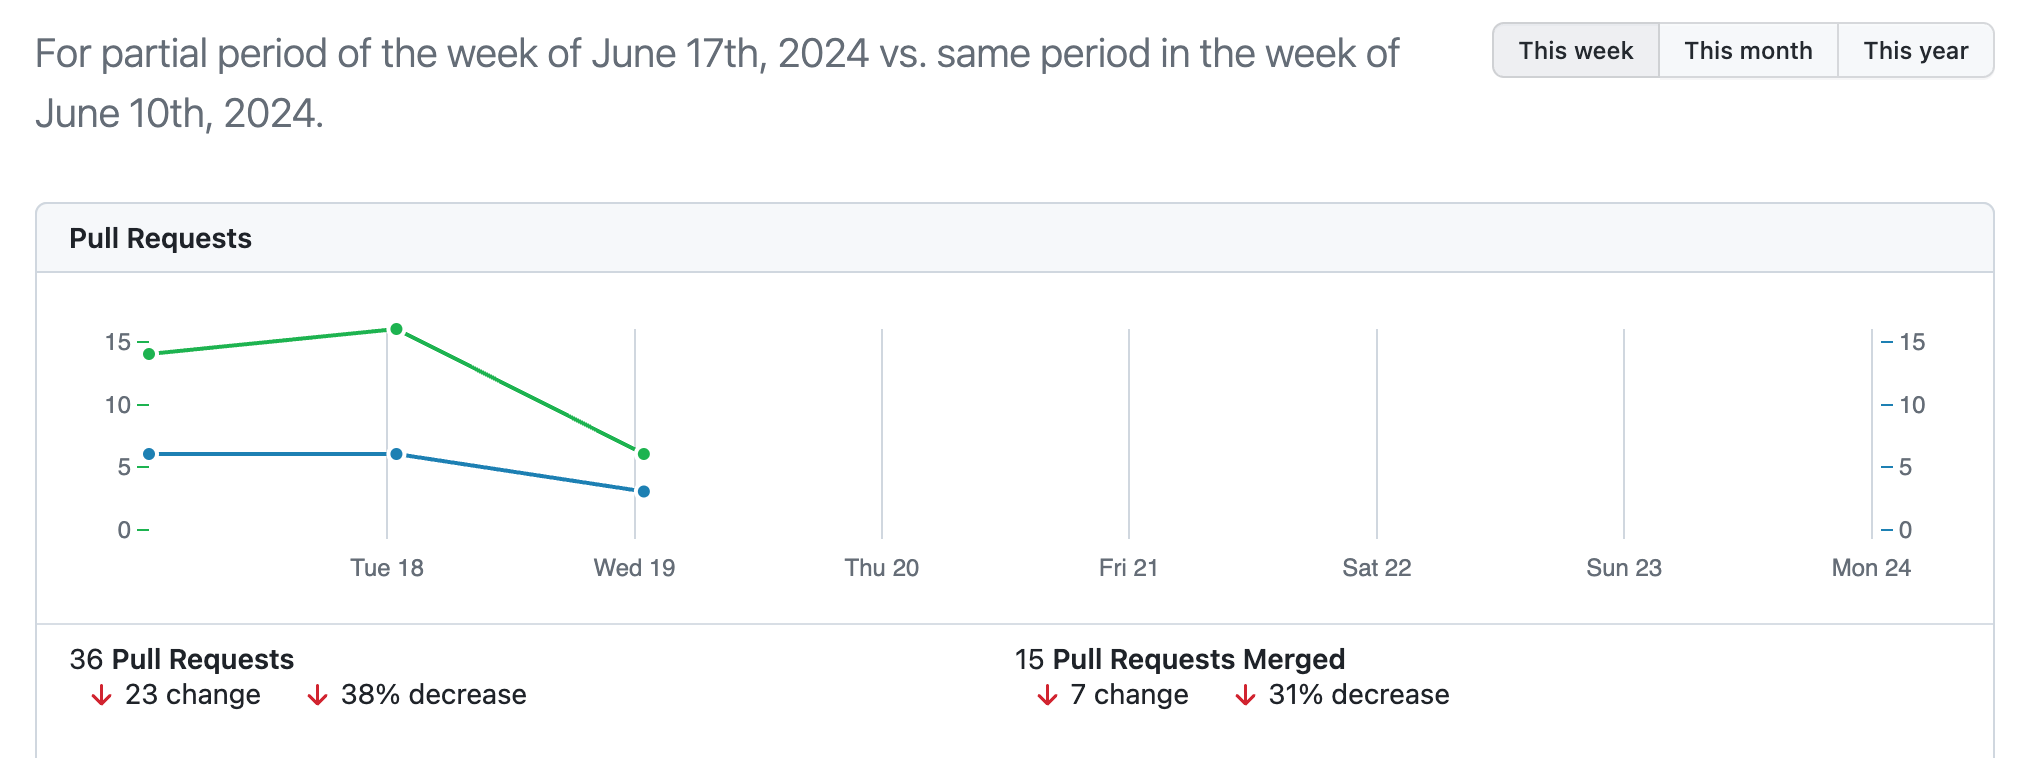
    Screenshot of the activity dashboard. A line graph compares the number of pull requests merged over this week and the previous week.