Accessing the monitor dashboard
-
From an administrative account on GitHub Enterprise Server, in the upper-right corner of any page, click .
-
If you're not already on the "Site admin" page, in the upper-left corner, click Site admin.
-
In the " Site admin" sidebar, click Management Console.
-
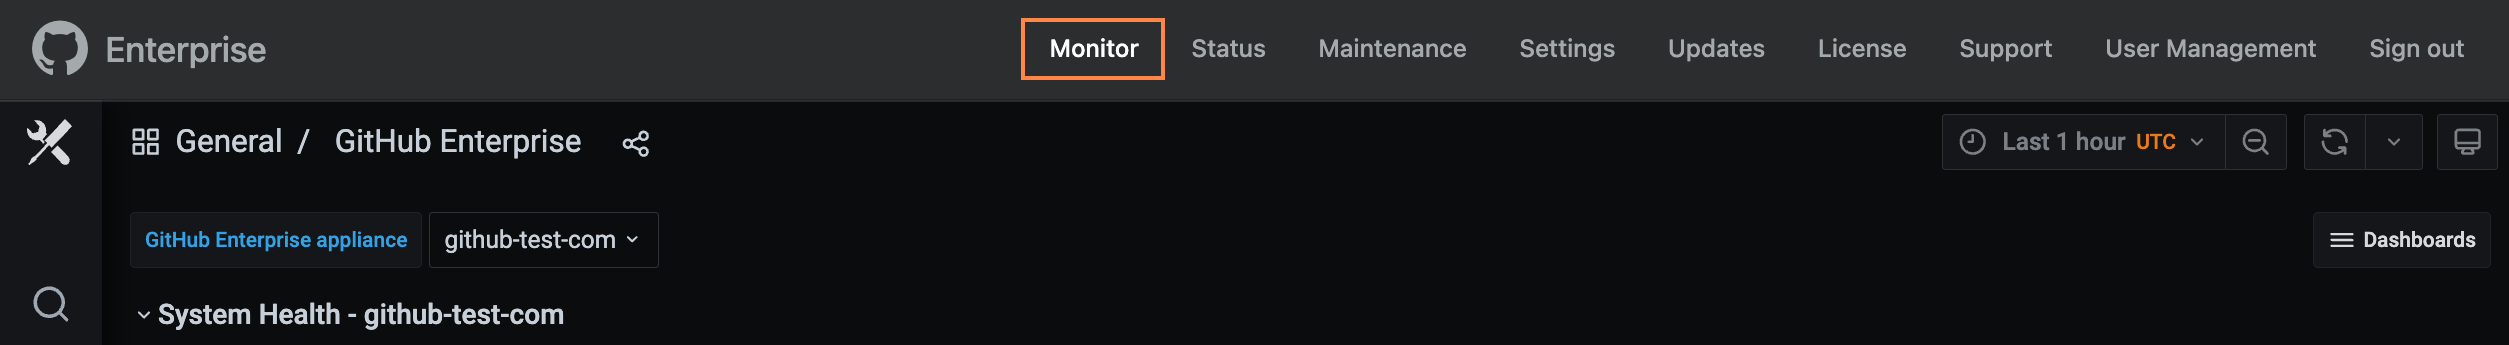
In the top navigation bar, click Monitor.
-
In HA and cluster environments you can switch between nodes using the dropdown and clicking on a different hostname.

Using the monitor dashboard
The page visualizes metrics which can be useful for troubleshooting performance issues and better understanding how your GitHub Enterprise Server appliance is being used. The data behind the graphs is gathered by the collectd service and sampled every 10 seconds.
Within the pre-built dashboard you can find various sections grouping graphs of different types of system resources.
Building your own dashboard and alerts requires the data to be forwarded to an external instance, by enabling collectd forwarding. For more information, see "Configuring collectd for your instance."
About the metrics on the monitor dashboard
System health
The system health graphs provide a general overview of services and system resource utilization. The CPU, memory, and load average graphs are useful for identifying trends or times where provisioned resource saturation has occurred. For more information, see "Recommended alert thresholds."
Processes
The processes graph section looks deeper into the major individual services which make up the GitHub Enterprise Server appliance. Looking at these services individually can show how usage trends impact system resources over time.
Authentication
The authentication graphs break down the rates at which users and applications are authenticating to the GitHub Enterprise Server appliance. We also track the protocol or service type such as Git or API for the authentications, which is useful in identifying broad user activity trends. The authentication graphs can help you find interesting trends or timeframes to look at when diving deeper into authentication and API request logs.
LDAP
LDAP graphs will only display data if LDAP authentication is enabled on the GitHub Enterprise Server appliance. For more information, see "Using LDAP." These graphs can help you to identify slow responses from your LDAP server, as well as the overall volume of LDAP password based authentications.
App servers
The application servers section provides insight into the activity of GitHub Enterprise Server services which provide data to users and integrations.
App request/response
The App request/response section looks at the rate of requests, how quickly those requests are responded to, and with what status they returned.
Actions
The graphs break down different metrics about GitHub Actions on your GitHub Enterprise Server instance including an overview of GitHub Actions services web requests.
Background jobs
Number of tasks queued for background processing on the GitHub Enterprise Server appliance.
Network
The network interface graphs can be useful in profiling user activity, and throughput of traffic in and out of the GitHub Enterprise Server appliance.
Storage
GitHub Enterprise Server repository performance is very dependent on the underlying storage system. Low latency, local SSD disks provide the highest performance. For more information on the GitHub Enterprise storage architecture, see "System overview."
Appliance-specific system services
System services graphs contain data related to the major databases on GitHub Enterprise Server. These are MySQL, and Elasticseach persistent databases, as well as Redis and Memcached which contain ephemeral data.
- Memcached: Provides a layer of in-memory caching for web and API operations. Memcached helps to provide quicker response times for users and integrations interacting with the system.
- MySQL: The primary database in GitHub Enterprise Server. User, issue, and other non-git or search related metadata is stored within MySQL.
- Nomad Jobs: GitHub Enterprise Server utilizes Nomad internally as the workload orchestrator, where the CPU and memory usage of individual services can be seen.
- Redis: The database mainly contains background job queue, as well as session state information.
- Kafka-Lite: Kafka broker service for job processing.
- Elasticsearch: Powers the built-in search features in GitHub Enterprise Server.
- Custom hooks: Graphs related to pre-receive hook execution.
- Git fetch caching: GitHub Enterprise Server will attempt to cache intensive operations, such as Git pack-objects, when multiple identical requests arrive in quick succession.
- MinIO: Storage used by some GitHub Enterprise Server services.
- Packages: Requests powering GitHub Packages.
- SecretScanning: Services powering Secret scanning features.
- CodeScanning: Services powering Code scanning features.
- Cluster: Graphs related to GitHub Enterprise Server high availability or clustering.
- Babeld: Git proxy.
- Alive: Service powering live updates.
- Ghes-manage: Service powering GHES Manage API.