Viewing a repository's network
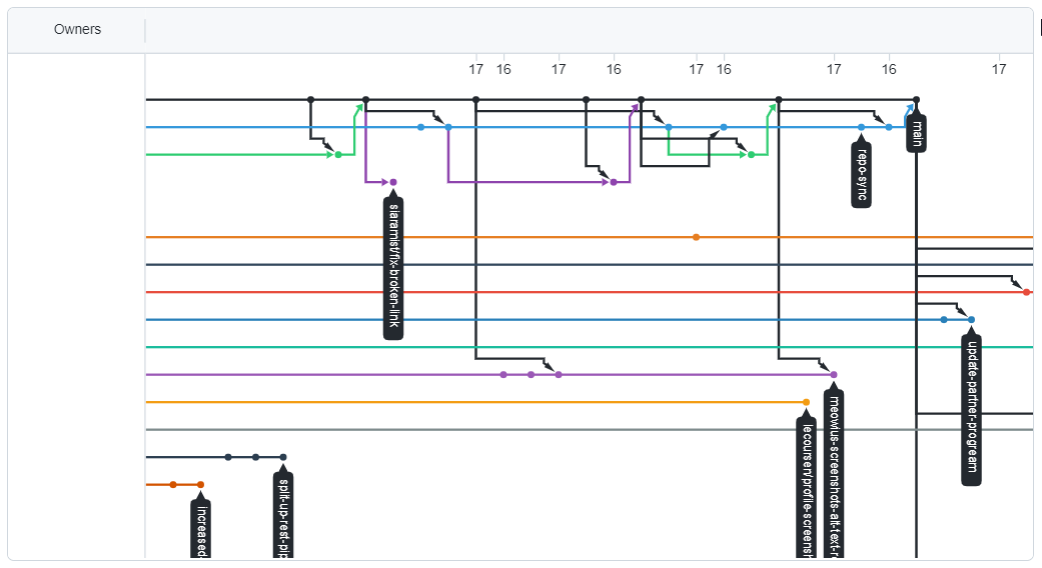
The network graph displays the branch history of the entire repository network, including fork branches. This graph is a timeline of the most recent commits, and shows up to 100 of the most recently pushed-to branches. The first row references the date and the first column references the branch owner. Use arrow keys or other keyboard shortcuts to more easily navigate the graph. They are provided in the “Keyboard shortcuts available” pop up under the graph.

Tip
To see older branches, click and drag within the graph.
Accessing the network graph
-
On GitHub, navigate to the main page of the repository.
-
Under your repository name, click Insights.

-
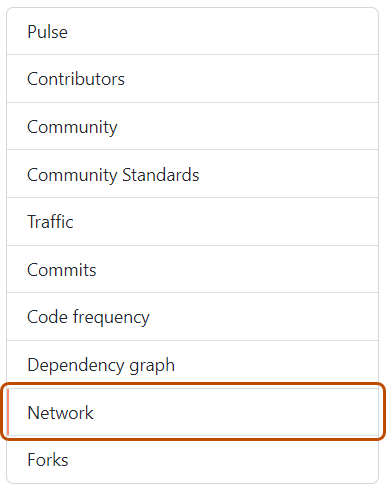
In the left sidebar, click Network.

Listing the forks of a repository
The forks page lists the forks of a repository. For each fork, you can see:
- How many times the fork has been starred
- The number of direct forks (of the fork)
- The number of open issues
- The number of open pull requests
- When the fork was last updated (that is, the last push to any branch)
- When the fork was created
You can filter the list of forks to display active, inactive, starred, or archived forks, or to only display forks that have been updated within a specified time period (up to a period of five years). To view the most useful or most active forks, you can sort the list of forks by most starred forks or most recently updated forks, or by the number of open issues or open pull requests.
If you want to preserve the filters you have selected, you can save your filter and sort selections as the default so that any forks page you view, in any repository, will be filtered the same way.
Accessing the forks page
-
On GitHub, navigate to the main page of the repository.
-
Under your repository name, click Insights.

-
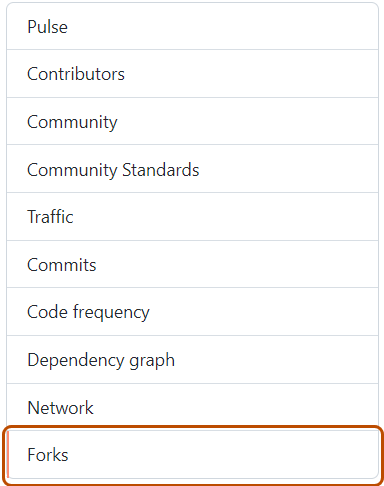
In the left sidebar, click Forks.

-
Optionally, to filter the list to display forks updated within a specified time period, click Period, then choose a time period from the dropdown menu. For example, to see forks that have been updated within the last two years, choose "2 years" from the dropdown menu.

-
Optionally, to filter the list to only display active, inactive, starred, or archived forks, click Repository type, then choose one or multiple options from the dropdown menu. To clear a filter, click Repository type, then click the applied filter again to remove it.

-
Optionally, to sort the list by most starred forks, most recently updated forks, most open issues, or most open pull requests, click Sort, then choose an option from the dropdown menu.

-
Optionally, to preserve the filter values you have selected as the default filters for any time you view a forks page, click Save Defaults. If the currently selected filters are already the defaults, the button will be disabled and labeled as Defaults Saved.

Viewing the dependencies of a repository
You can use the dependency graph to explore the code your repository depends on.
Almost all software relies on code developed and maintained by other developers, often known as a supply chain. For example, utilities, libraries, and frameworks. These dependencies are an integral part of your code and any bugs or vulnerabilities in them may affect your code. It's important to review and maintain these dependencies.
The dependency graph provides a great way to visualize and explore the dependencies for a repository. For more information, see About the dependency graph and Exploring the dependencies of a repository.
You can also set up your repository so that GitHub alerts you automatically whenever a security vulnerability is found in one of your dependencies. For more information, see About Dependabot alerts.