
Эта версия GitHub Enterprise Server была прекращена 2024-07-09. Исправления выпускаться не будут даже при критических проблемах безопасности. Для повышения производительности, повышения безопасности и новых функций выполните обновление до последней версии GitHub Enterprise Server. Чтобы получить справку по обновлению, обратитесь в службу поддержки GitHub Enterprise.

Панель мониторинга активности

Панель мониторинга активности содержит общие сведения обо всей деятельности на предприятии.

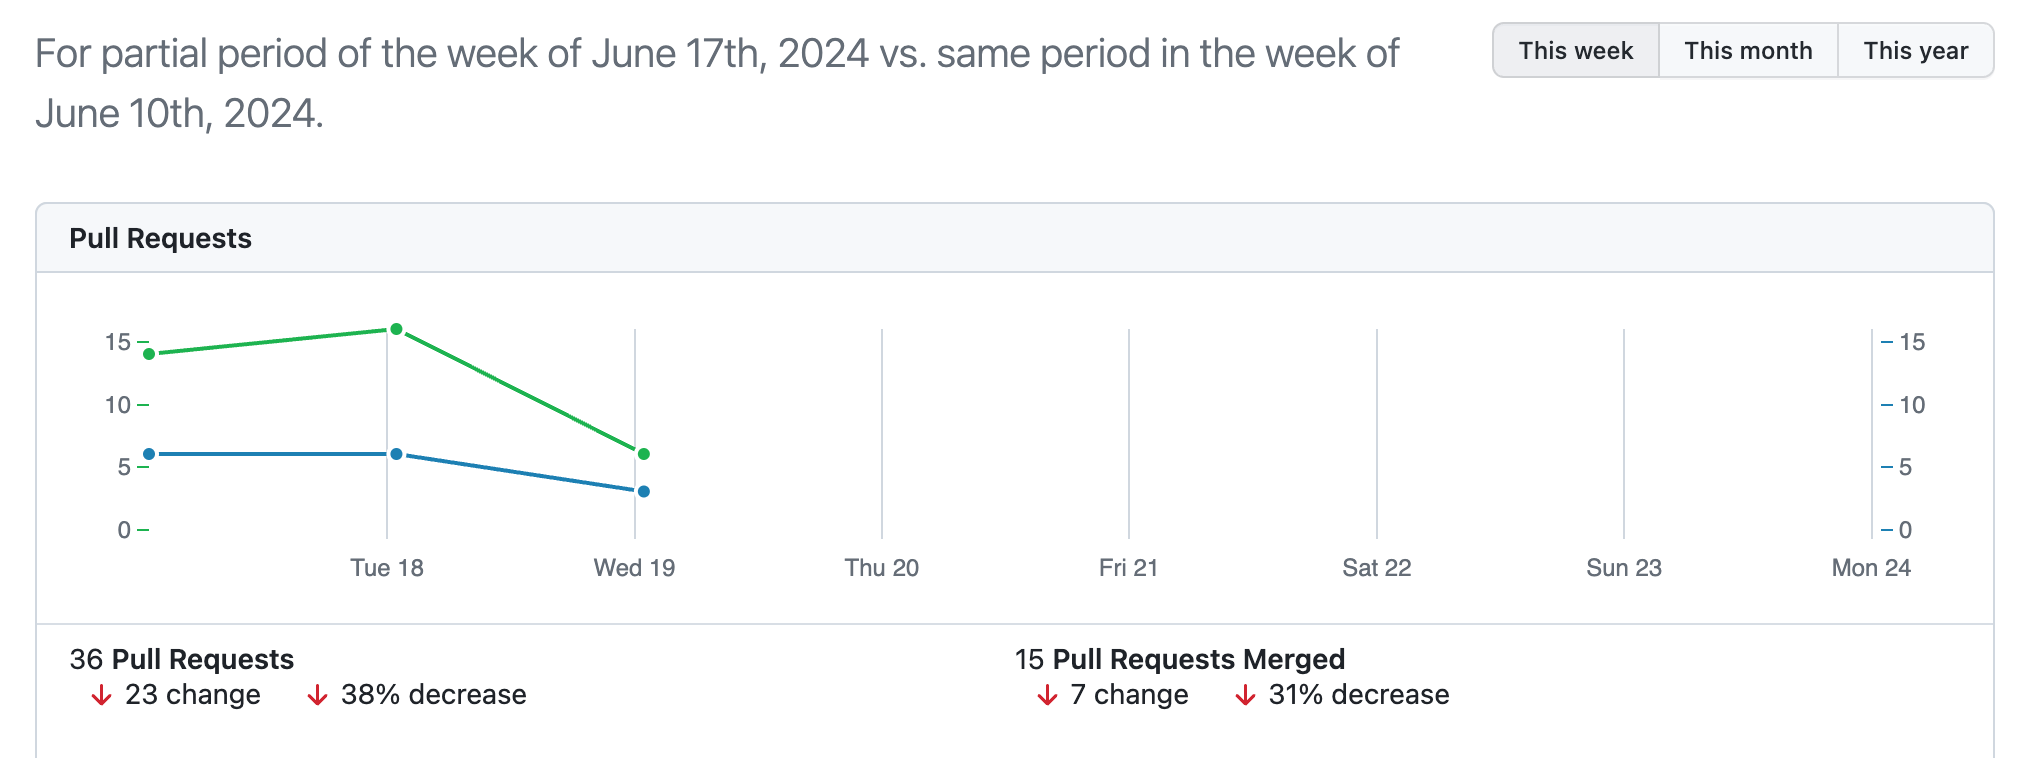
The Activity dashboard provides weekly, monthly, and yearly graphs of the number of:

  • New pull requests
  • Merged pull requests
  • New issues
  • Closed issues
  • New issue comments
  • New repositories
  • New user accounts
  • New organizations
  • New teams

Accessing the Activity dashboard

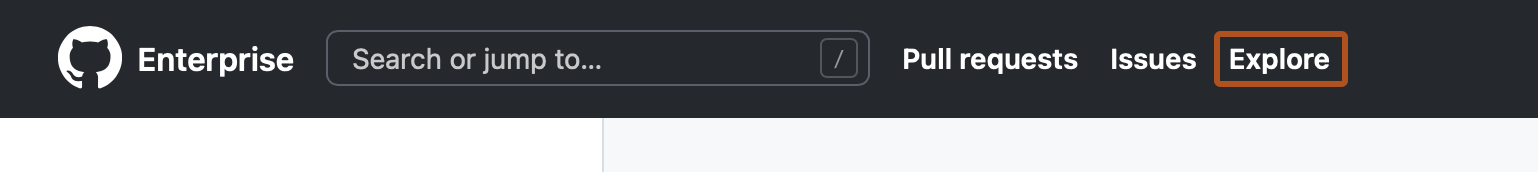
  1. At the top of any page, click Explore.

    Screenshot of the navigation bar at the top of the web UI for GitHub Enterprise Server. The word "Explore" is highlighted with an orange outline.

  2. In the upper-right corner of the page, click Activity.

  3. To view activity over different periods, click This week, This month, or This year.

    Screenshot of the activity dashboard. A line graph compares the number of pull requests merged over this week and the previous week.