Troubleshooting the Visual Studio Code web client
If you encounter issues using GitHub Codespaces in a browser that is not Chromium-based, try switching to a Chromium-based browser, such as Google Chrome or Microsoft Edge. Alternatively, check for known issues with your browser in the microsoft/vscode repository by searching for issues labeled with the name of your browser, such as firefox or safari.
If you encounter issues using GitHub Codespaces in a Chromium-based browser, you can check if you're experiencing another known issue with VS Code in the microsoft/vscode repository.
Differences from working in VS Code locally
When you open a codespace in your browser, using the VS Code web client, you will notice some differences from working in a local workspace in the VS Code desktop application. For example, some key bindings will be different or missing, and some extensions may behave differently. For a summary, see: Known limitations and adaptions in the VS Code docs.
You can check for known issues and log new issues with the VS Code experience in the microsoft/vscode repository.
Visual Studio Code Insiders
Visual Studio Code Insiders is the most frequent release of VS Code. It has all the latest features and bug fixes, but may also occasionally contain new issues that result in a broken build.
If you are using an Insiders build and notice broken behavior, we recommend switching to Visual Studio Code Stable and trying again.
Click in the bottom left of the editor and select Switch to Stable Version.... If the VS Code web client doesn't load, or isn't available, you can force switching to Visual Studio Code Stable by appending ?vscodeChannel=stable to your codespace URL and loading the codespace at that URL.
If the problem isn't fixed in Visual Studio Code Stable, check for known issues and, if required, log a new issue with the VS Code experience, in the microsoft/vscode repository.
Troubleshooting the Simple Browser
When you have started a web application in a codespace, you can preview the running application in the Simple Browser embedded in VS Code. In some projects, the application automatically opens in a Simple Browser tab in the editor when the application starts. This happens if, in the devcontainer.json configuration file for the codespace, the onAutoForward property of the port the application runs on is set to openPreview.
"portsAttributes": {
  "3000": {
    "label": "Application",
    "onAutoForward": "openPreview"
  }
}
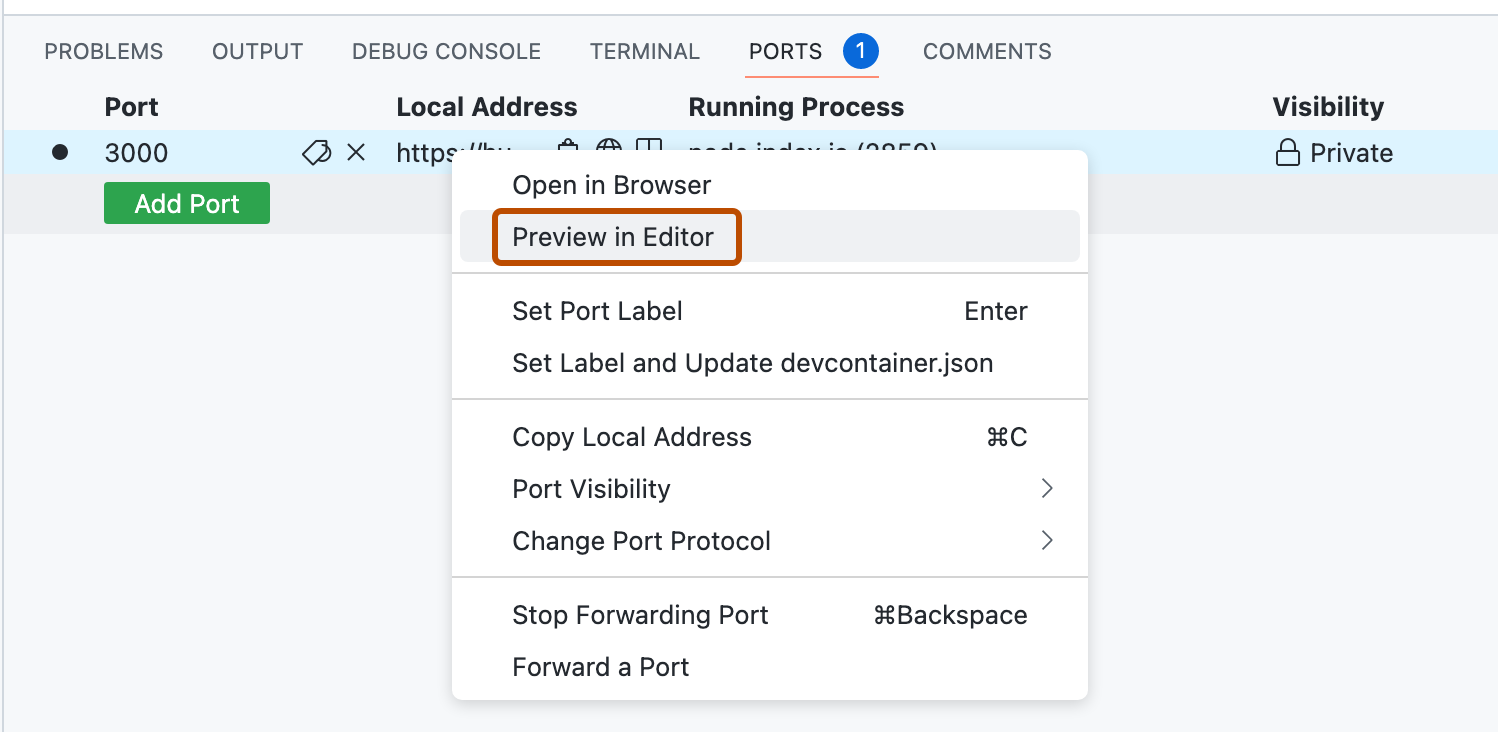
If the Simple Browser tab does not open automatically, you can open the Simple Browser manually to view the application.
-
In VS Code, click the Ports tab.
-
Right-click the port, then click Preview in Editor.

The simple browser tab does not open automatically
If the devcontainer.json configuration file specifies "onAutoForward": "openPreview" for a port, but the Simple Browser does not open automatically when an application starts, check that the application has started on the port specified in the configuration. The application might start on a different port if the intended port is busy.
To implement the port configuration specified in devcontainer.json, GitHub Codespaces writes the configuration to VS Code's settings.json file when a codespace is created. You can check that the configuration has been correctly written to settings.json in your codespace.
-
In the terminal in your codespace, enter the following command.
Bash cat ~/.vscode-remote/data/Machine/settings.json
cat ~/.vscode-remote/data/Machine/settings.json -
Verify that the
settings.jsonfile contains lines like the following."remote.portsAttributes": { "3000": { "label": "Application", "onAutoForward": "openPreview" } }
If the settings.json file doesn't contain these settings, check whether you have dotfiles enabled, and whether any configuration in your dotfiles is overwriting the settings.json file. For more information, see Personalizing GitHub Codespaces for your account.
The application does not load
Occasionally, you may find that the Simple Browser tab opens, but displays an error page icon or a blank page instead of your running application. This can happen if the web application you are loading includes a content security policy (CSP) that restricts the domains in which the site's pages may be embedded. For more information, see CSP: frame-ancestors on the mdn website.
You may be able to change your application's frame-ancestors security policy locally to make the application display in the Simple Browser. Alternatively, if a frame-ancestors policy is causing the problem, you should be able to view the application by opening it in a regular browser tab rather than the simple browser. To do this, click the Ports tab in VS Code, right-click the port, and click Open in Browser.
VS Code troubleshooting
When you open a codespace in the VS Code desktop application, you may notice a few differences compared with working in a local workspace, but the experience should be similar.
If you encounter problems, you can check for known issues and log new issues with the VS Code experience in the microsoft/vscode repository.
Visual Studio Code Insiders
Visual Studio Code Insiders is the most frequent release of VS Code. It has all the latest features and bug fixes, but may also occasionally contain new issues that result in a broken build.
If you are using an Insiders build and notice broken behavior, we recommend switching to Visual Studio Code Stable and trying again.
To switch to Visual Studio Code Stable, close the Visual Studio Code Insiders application, open the Visual Studio Code Stable application, and re-open your codespace.
If the problem isn't fixed in Visual Studio Code Stable, check for known issues and, if required, log a new issue with the VS Code experience, in the microsoft/vscode repository.
Troubleshooting the Simple Browser
When you have started a web application in a codespace, you can preview the running application in the Simple Browser embedded in VS Code. In some projects, the application automatically opens in a Simple Browser tab in the editor when the application starts. This happens if, in the devcontainer.json configuration file for the codespace, the onAutoForward property of the port the application runs on is set to openPreview.
"portsAttributes": {
  "3000": {
    "label": "Application",
    "onAutoForward": "openPreview"
  }
}
If the Simple Browser tab does not open automatically, you can open the Simple Browser manually to view the application.
-
In VS Code, click the Ports tab.
-
Right-click the port, then click Preview in Editor.

The simple browser tab does not open automatically
If the devcontainer.json configuration file specifies "onAutoForward": "openPreview" for a port, but the Simple Browser does not open automatically when an application starts, check that the application has started on the port specified in the configuration. The application might start on a different port if the intended port is busy.
To implement the port configuration specified in devcontainer.json, GitHub Codespaces writes the configuration to VS Code's settings.json file when a codespace is created. You can check that the configuration has been correctly written to settings.json in your codespace.
-
In the terminal in your codespace, enter the following command.
Bash cat ~/.vscode-remote/data/Machine/settings.json
cat ~/.vscode-remote/data/Machine/settings.json -
Verify that the
settings.jsonfile contains lines like the following."remote.portsAttributes": { "3000": { "label": "Application", "onAutoForward": "openPreview" } }
If the settings.json file doesn't contain these settings, check whether you have dotfiles enabled, and whether any configuration in your dotfiles is overwriting the settings.json file. For more information, see Personalizing GitHub Codespaces for your account.
The application does not load
Occasionally, you may find that the Simple Browser tab opens, but displays an error page icon or a blank page instead of your running application. This can happen if the web application you are loading includes a content security policy (CSP) that restricts the domains in which the site's pages may be embedded. For more information, see CSP: frame-ancestors on the mdn website.
You may be able to change your application's frame-ancestors security policy locally to make the application display in the Simple Browser. Alternatively, if a frame-ancestors policy is causing the problem, you should be able to view the application by opening it in a regular browser tab rather than the simple browser. To do this, click the Ports tab in VS Code, right-click the port, and click Open in Browser.